Customizing Morning Sugar
The collection of parameters needed to manage and display data of any particular type is called a configuration. Morning Sugar ships with four configurations pre-defined:
- Hemoglobin A1C
- Blood Glucose
- Blood Pressure
- Weight
However, Morning Sugar also provides you with tools to add, modify or delete configurations at will. Start by tapping the Edit button on the Morning Sugar Control Panel.
Configuration List
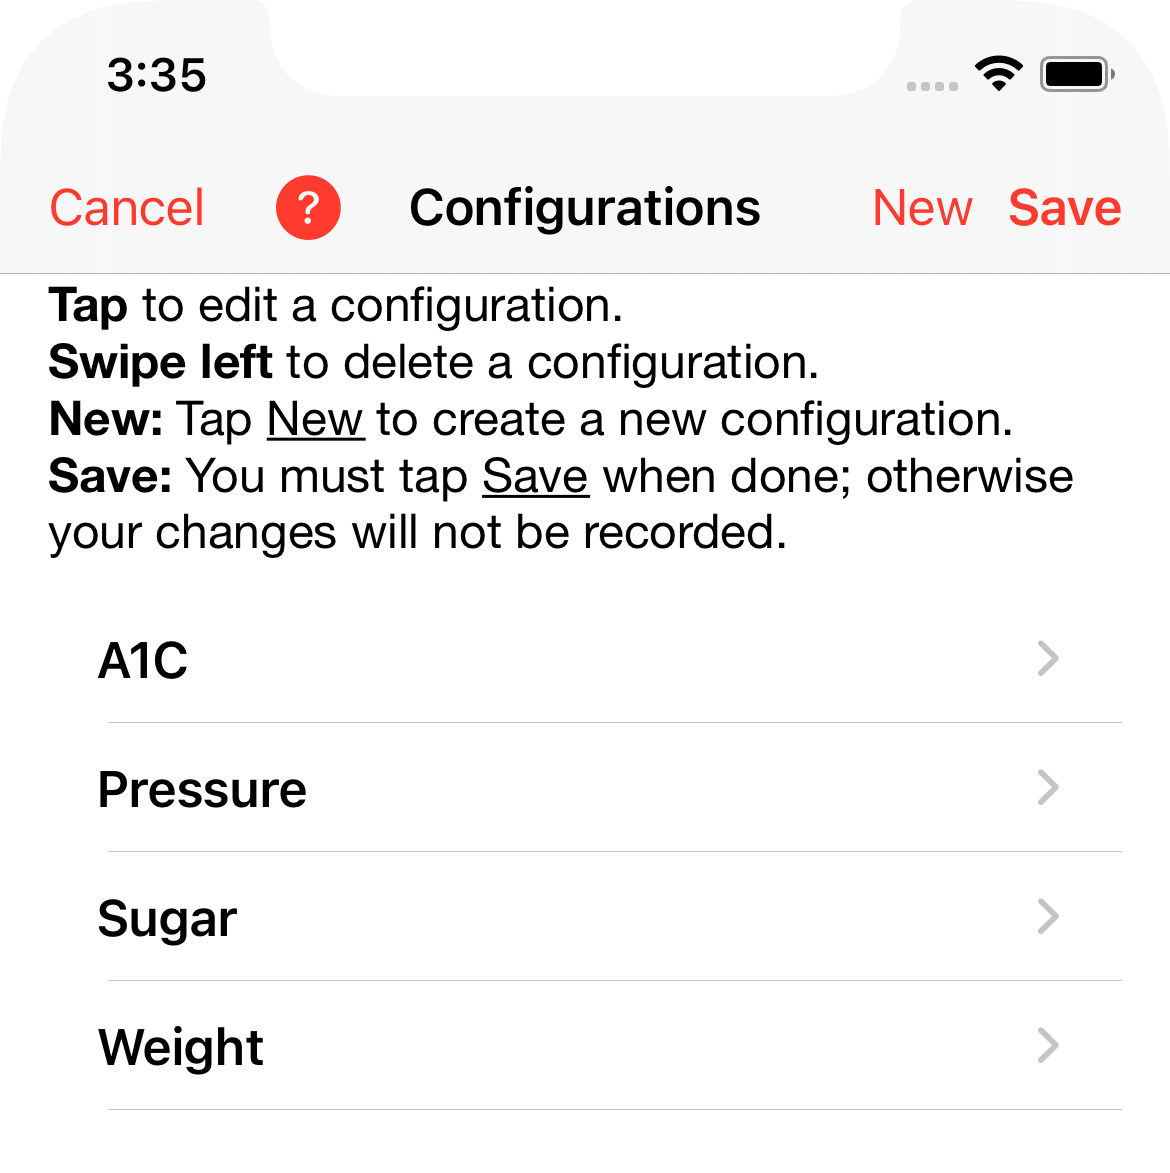
This is a list of all the configurations that are currently defined. You can
- Tap Cancel to return the the Control Panel without saving any changes you might have made.
- Tap New to define a new configuration.
- Tap Save to save your work and return to the Control Panel.
- Tap on a row in the list to edit that configuration.
- Swipe left on a row to delete that configuration.
Adding a New Configuration
Let's add a configuration for step count. Start by tapping New.
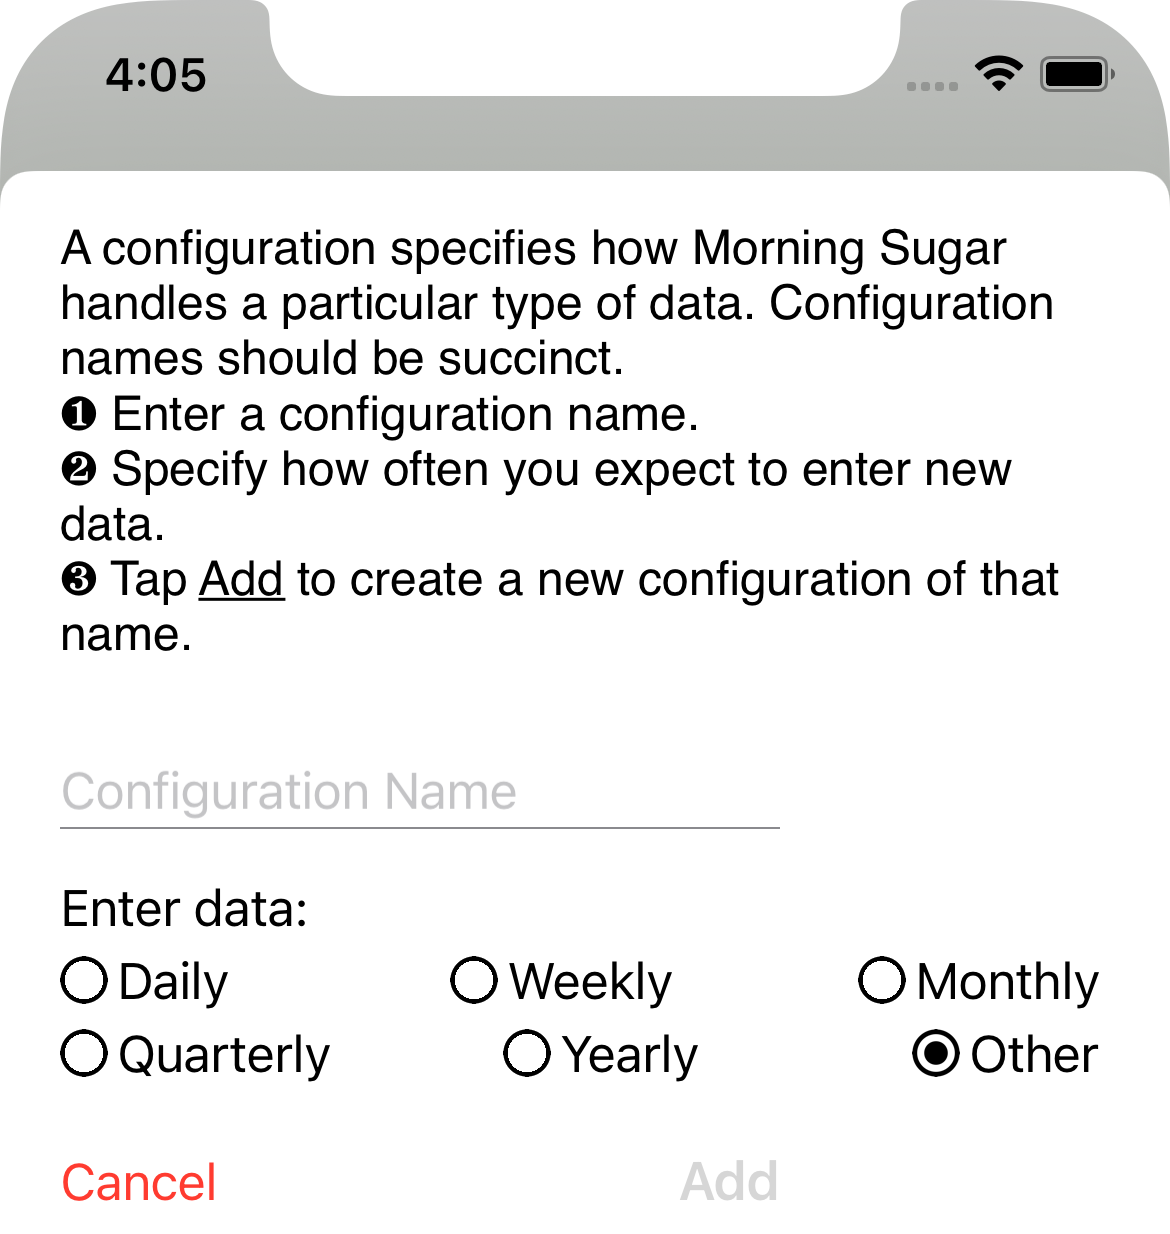
and fill in the configuration name. The set of data frequency buttons help Morning Sugar set up reasonable starting values for your configuration.
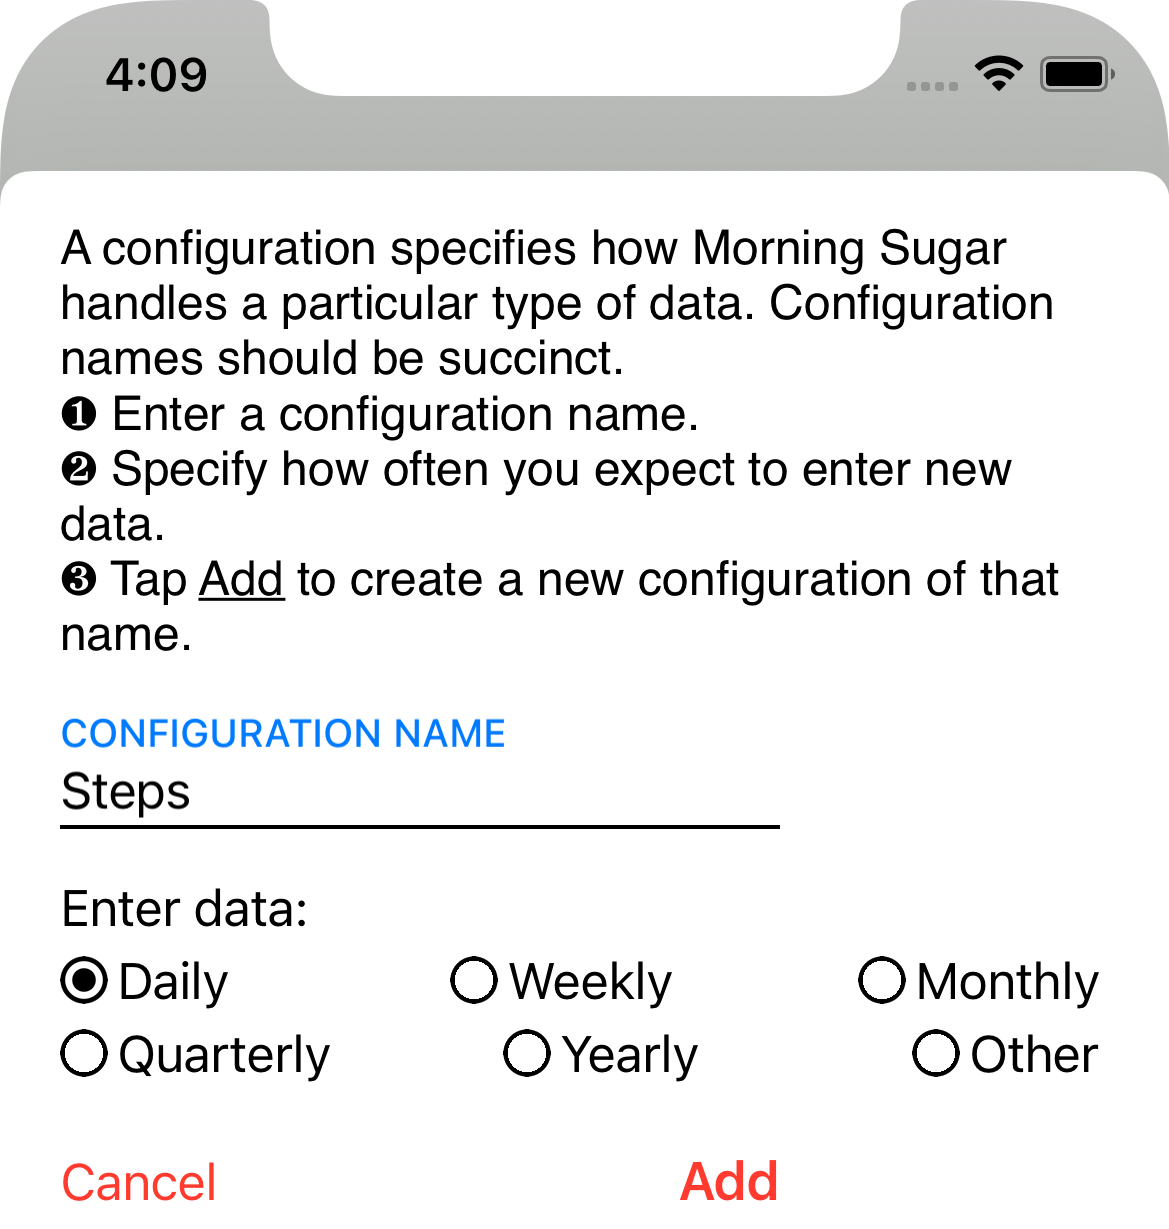
Tap Add. The configuration list will appear with your new configuration included.
Editing a Configuration
Tap on the configuration you want to edit. The Configuration Editor will appear. This (scrolling) panel has four sections — General, Colors, Y Axis, and X Axis. (You'll need to scroll vertically to see everything.)
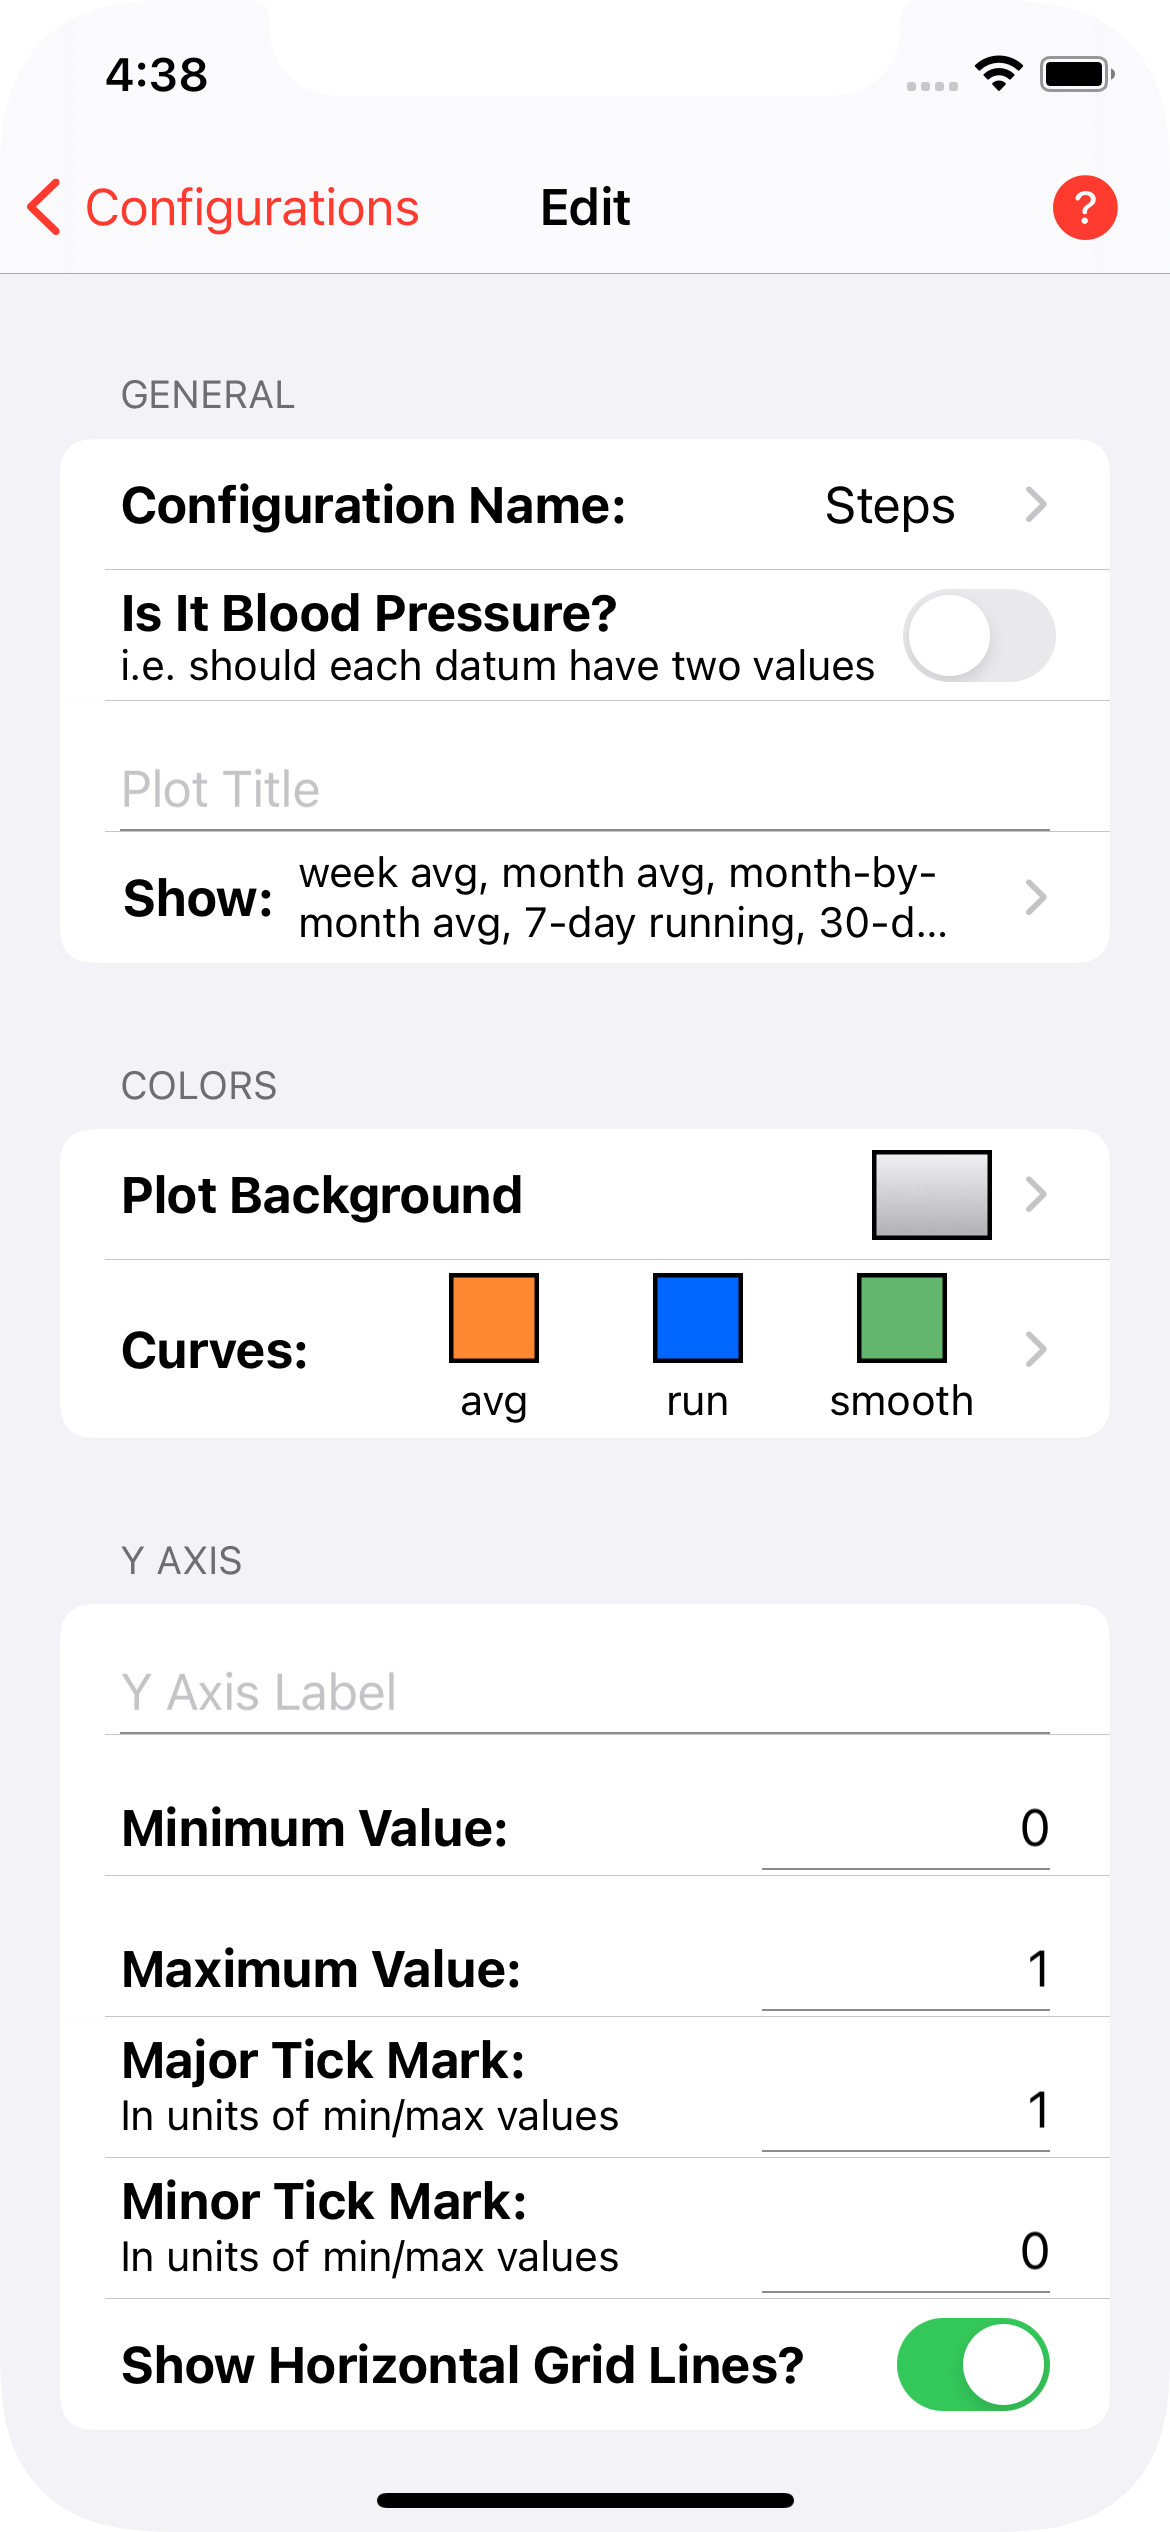
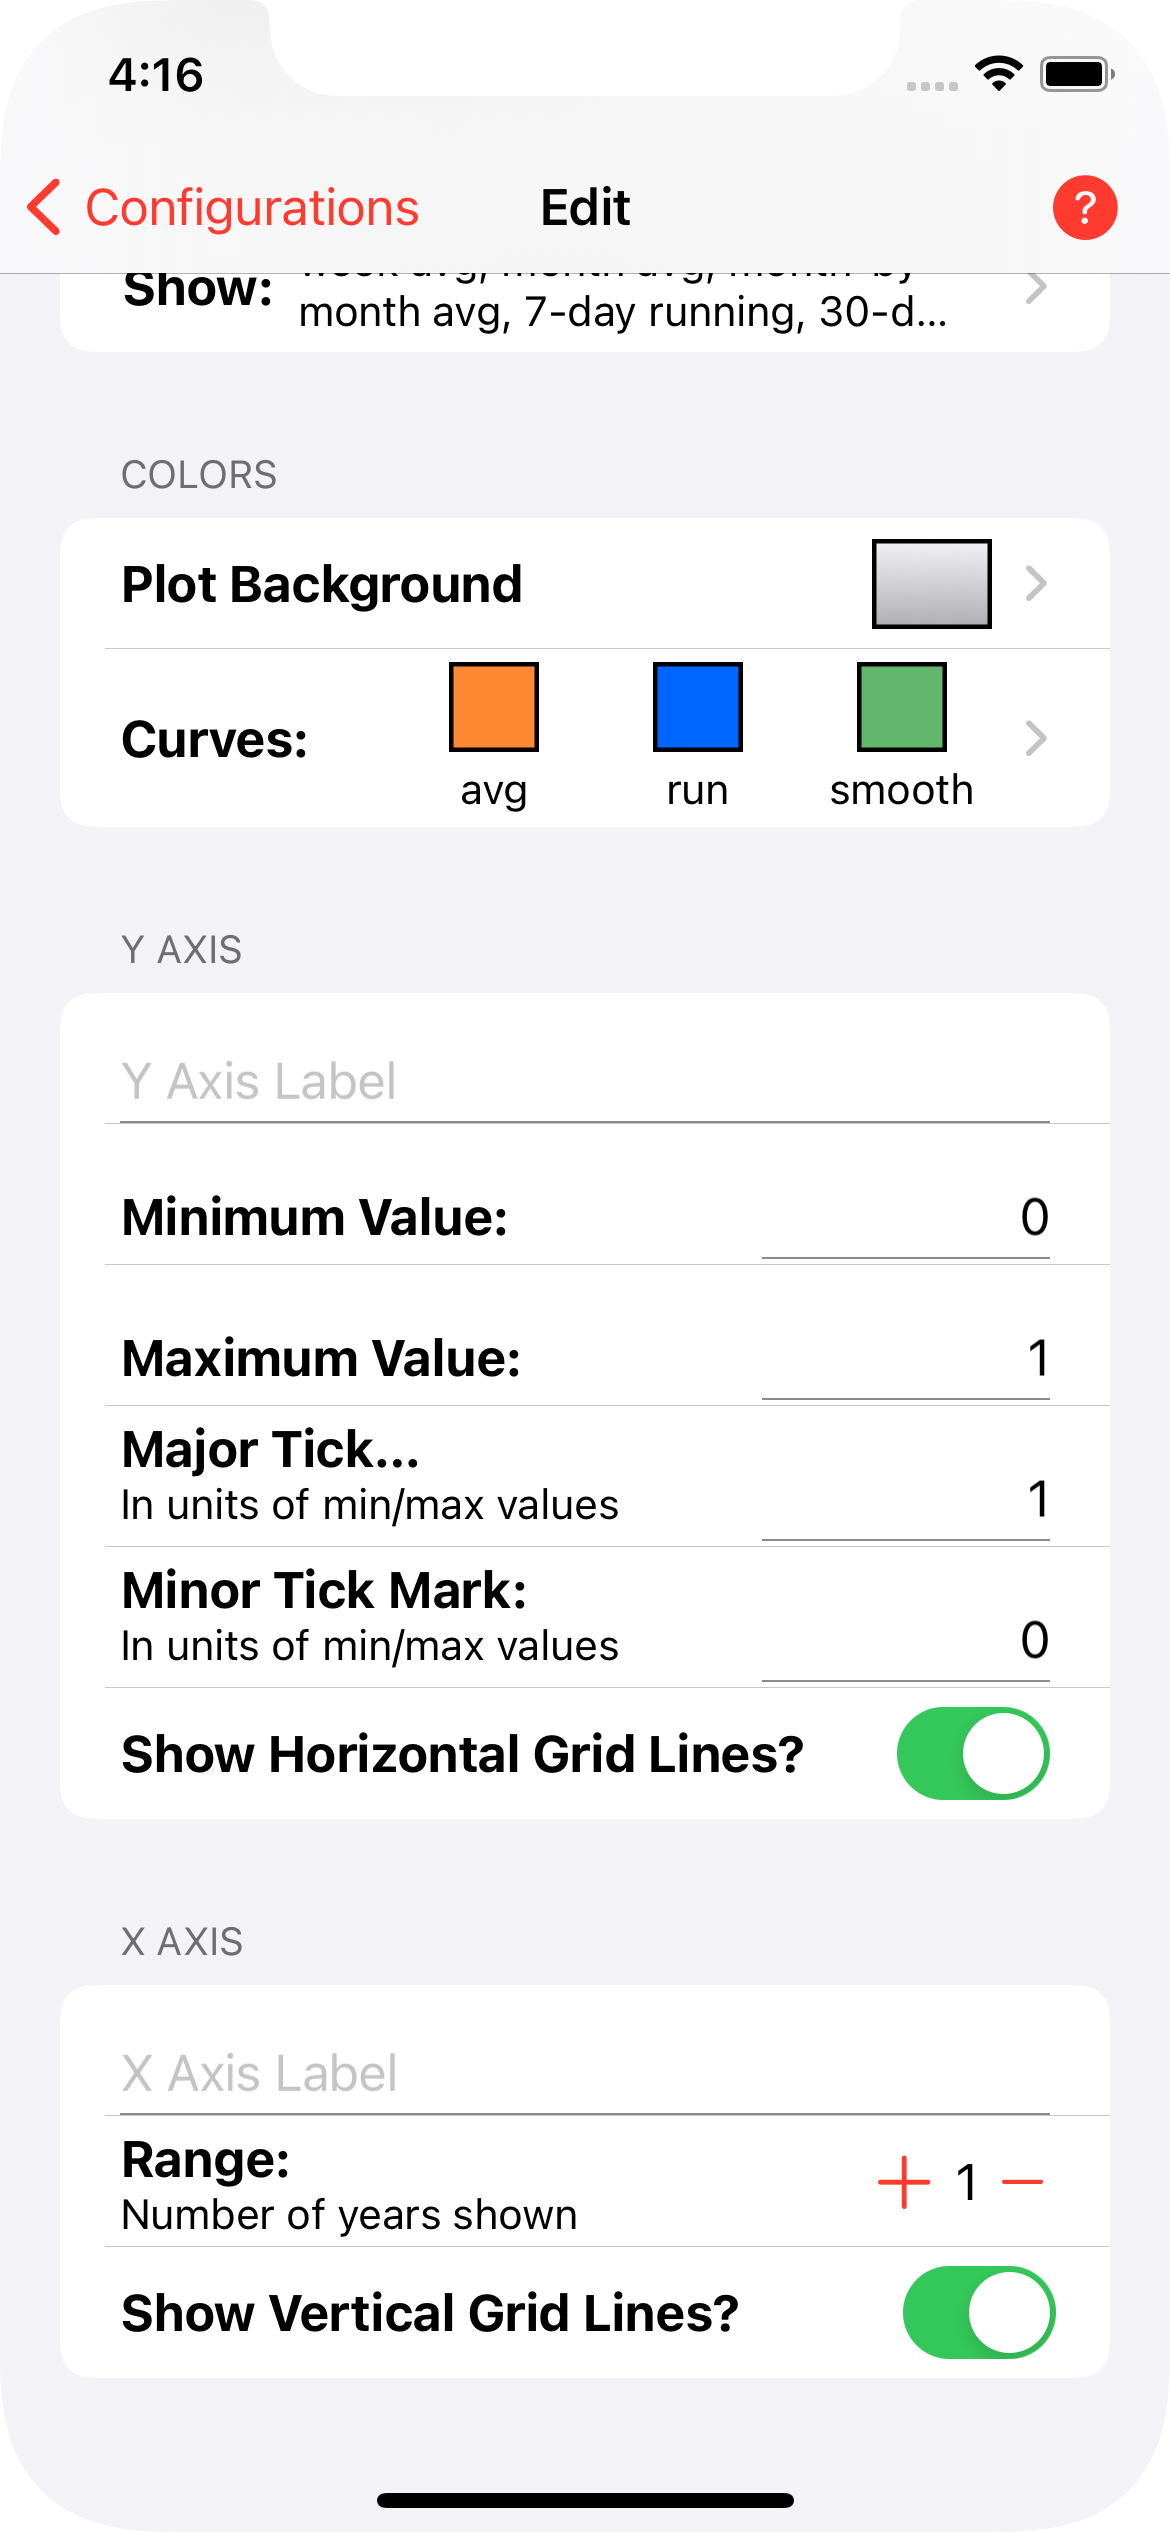
General Section
- Configuration Name: tap to change the name of this configuration.
- Is It Blood Pressure?: controls whether Morning Sugar collects one or two values for each data point.
- Plot Title: is the title displayed at the top of the plot view.
- Show: is the set of plotting options included in the plot legend. Tapping this item displays the legend options panel.
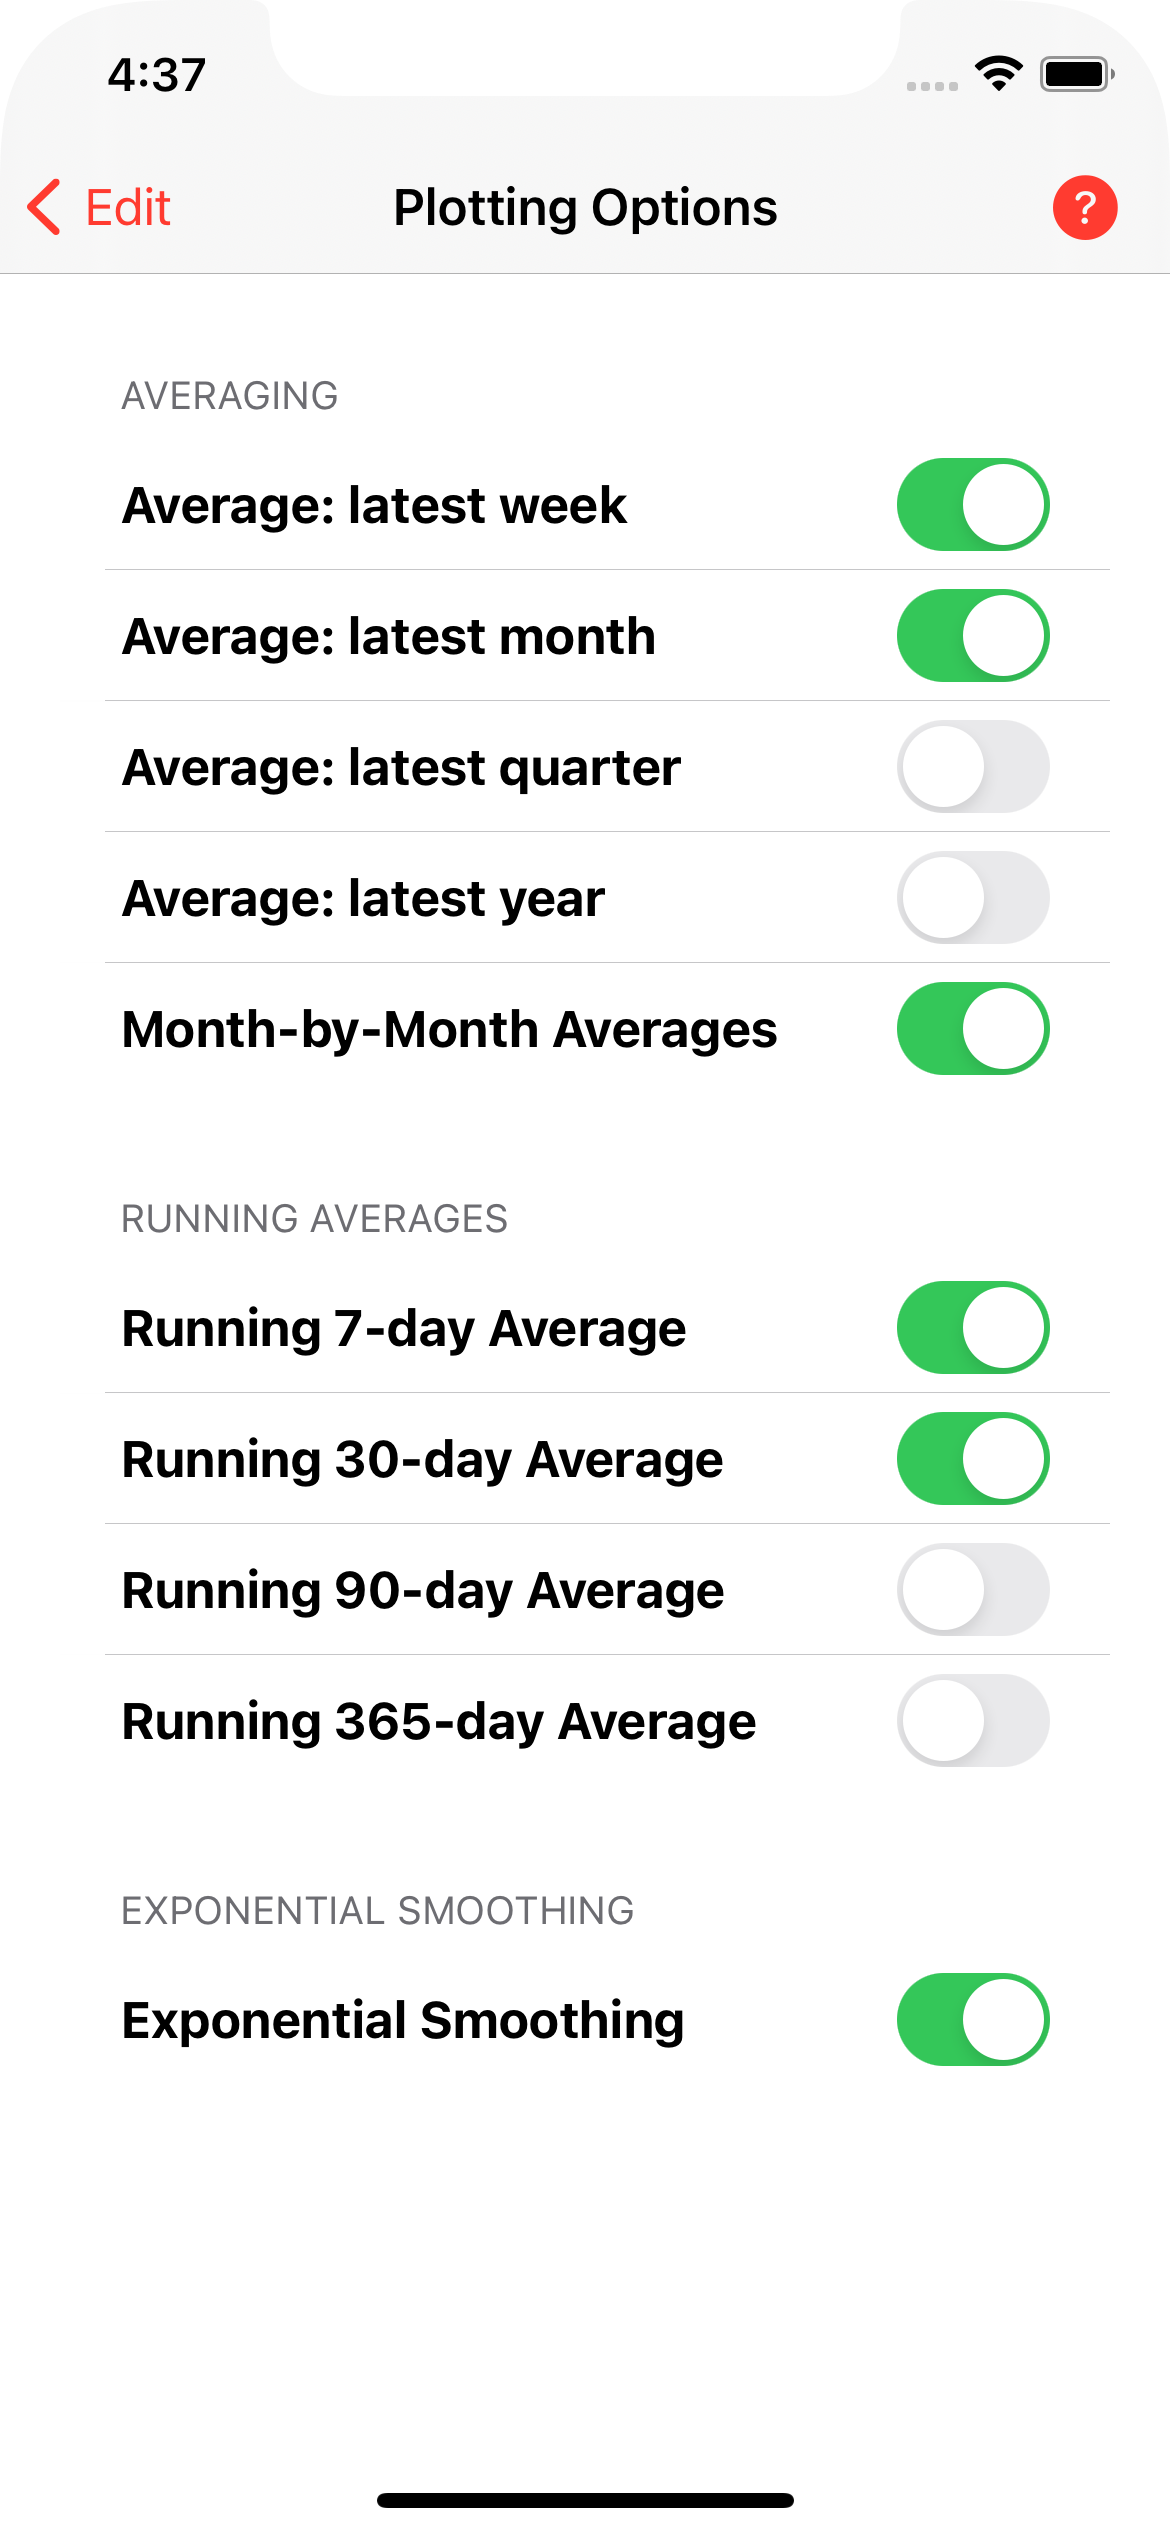
Colors Section
This section allows you to define the plot background color scheme and the colors used for the average, running average and smoothing curves.
Plot Background
Tap Plot Background.
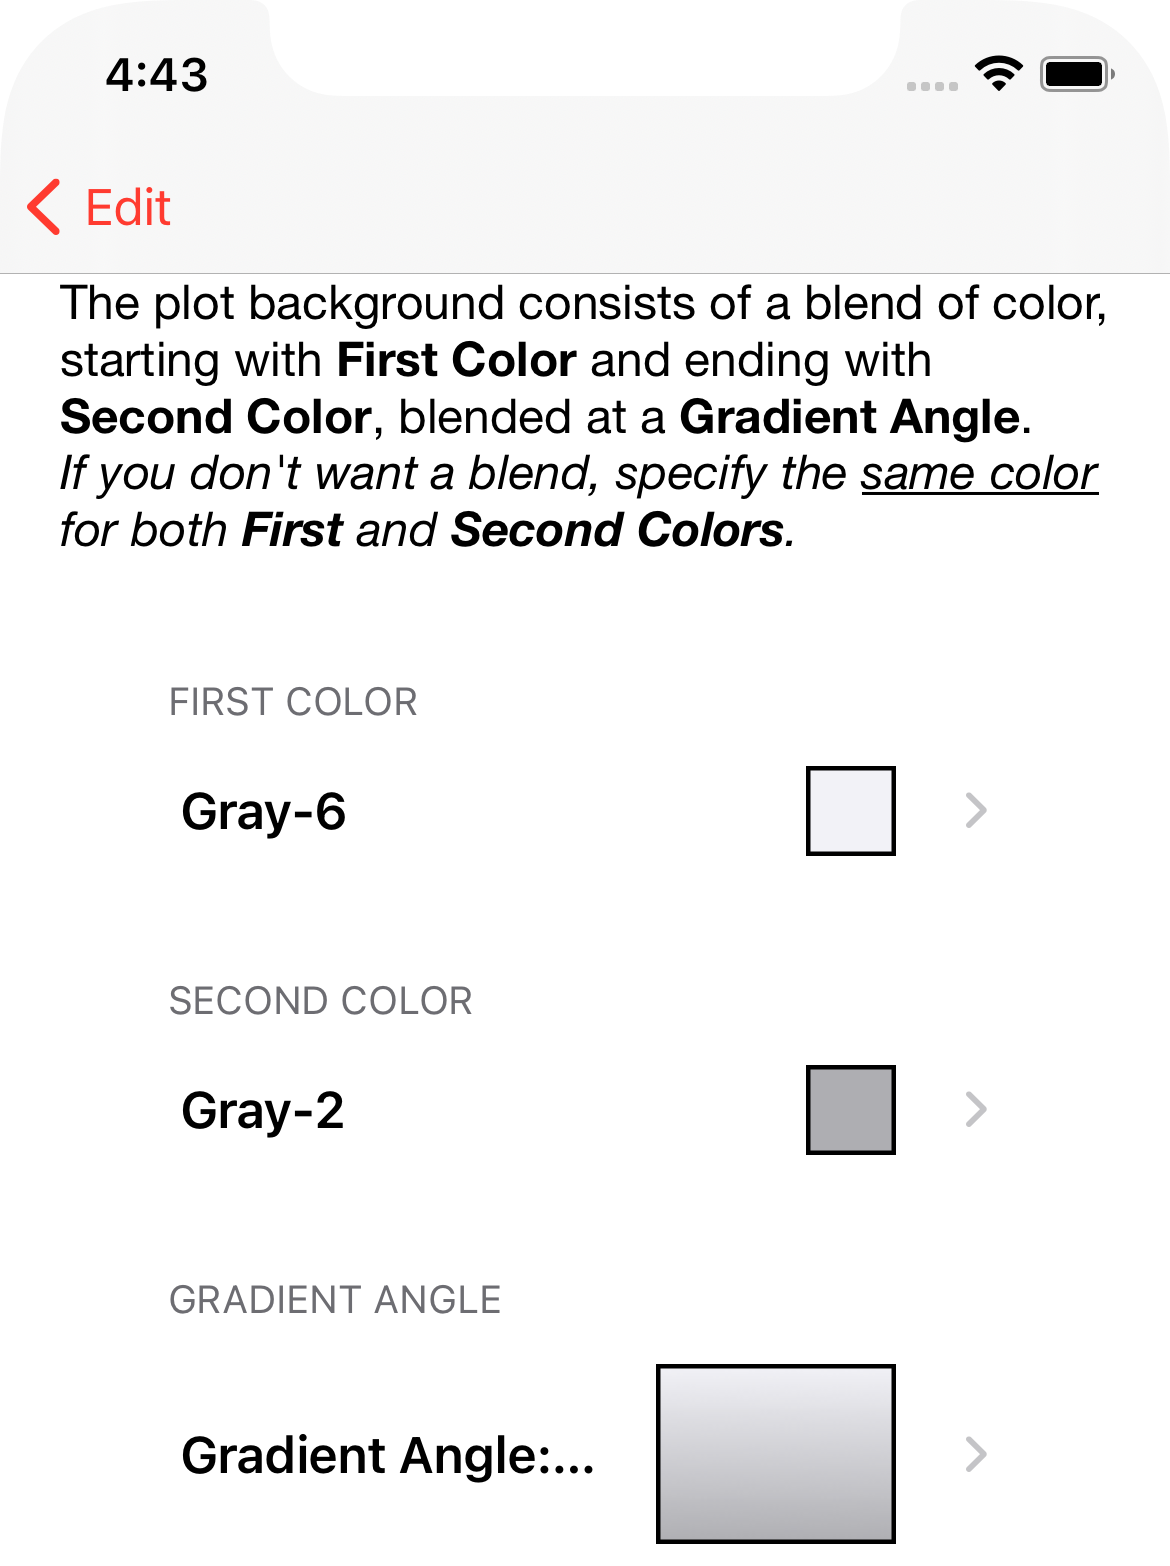
You can define two colors and the gradient angle.
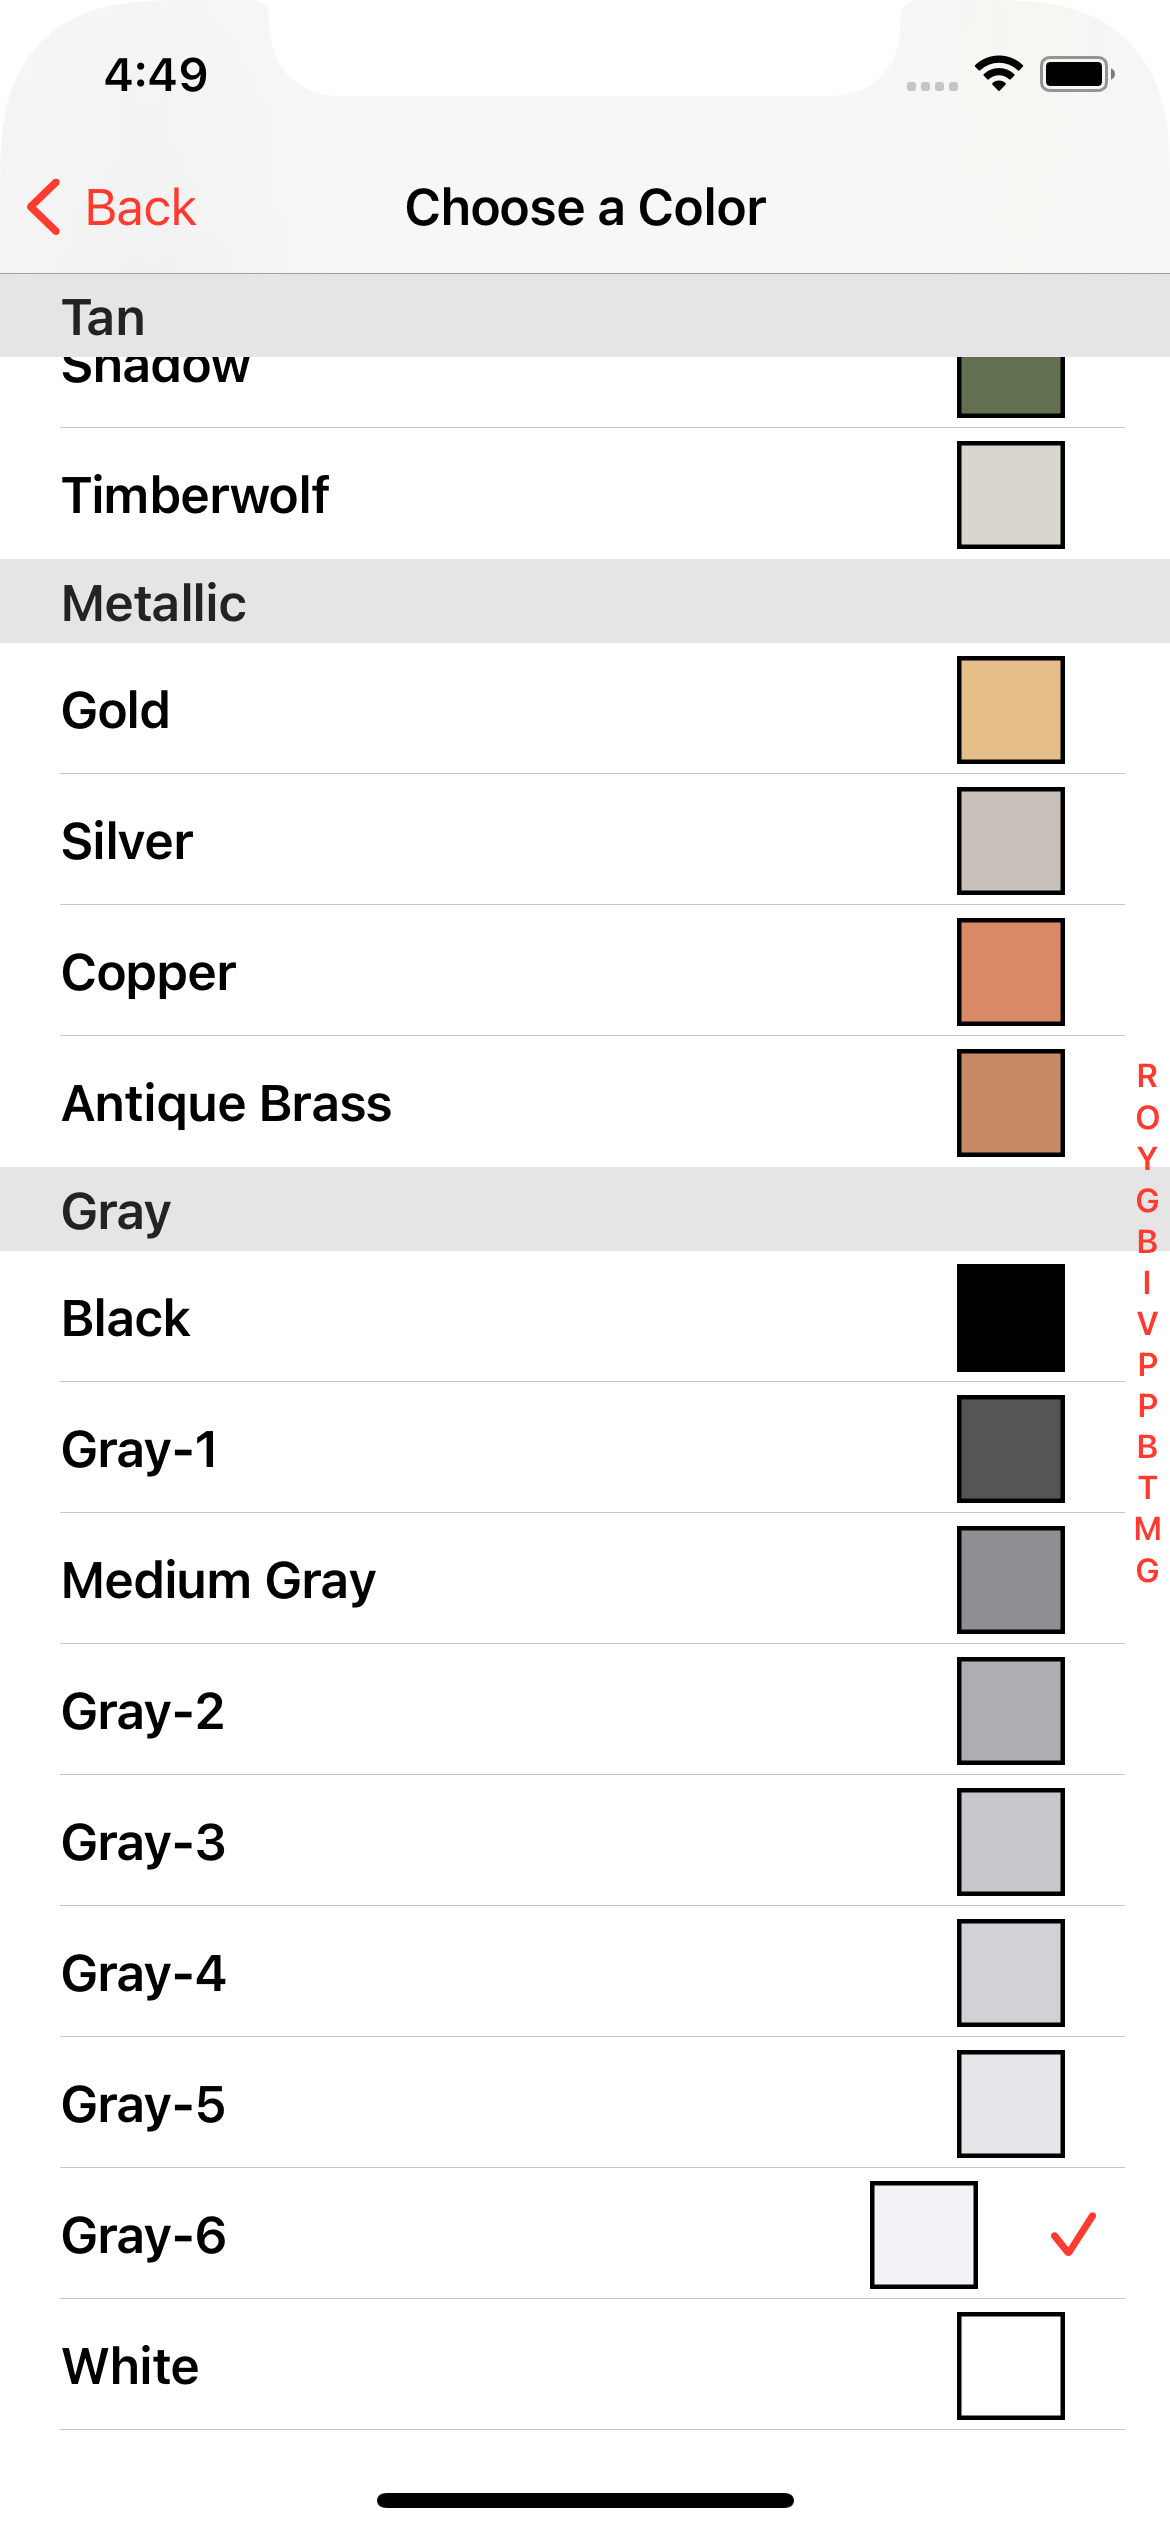
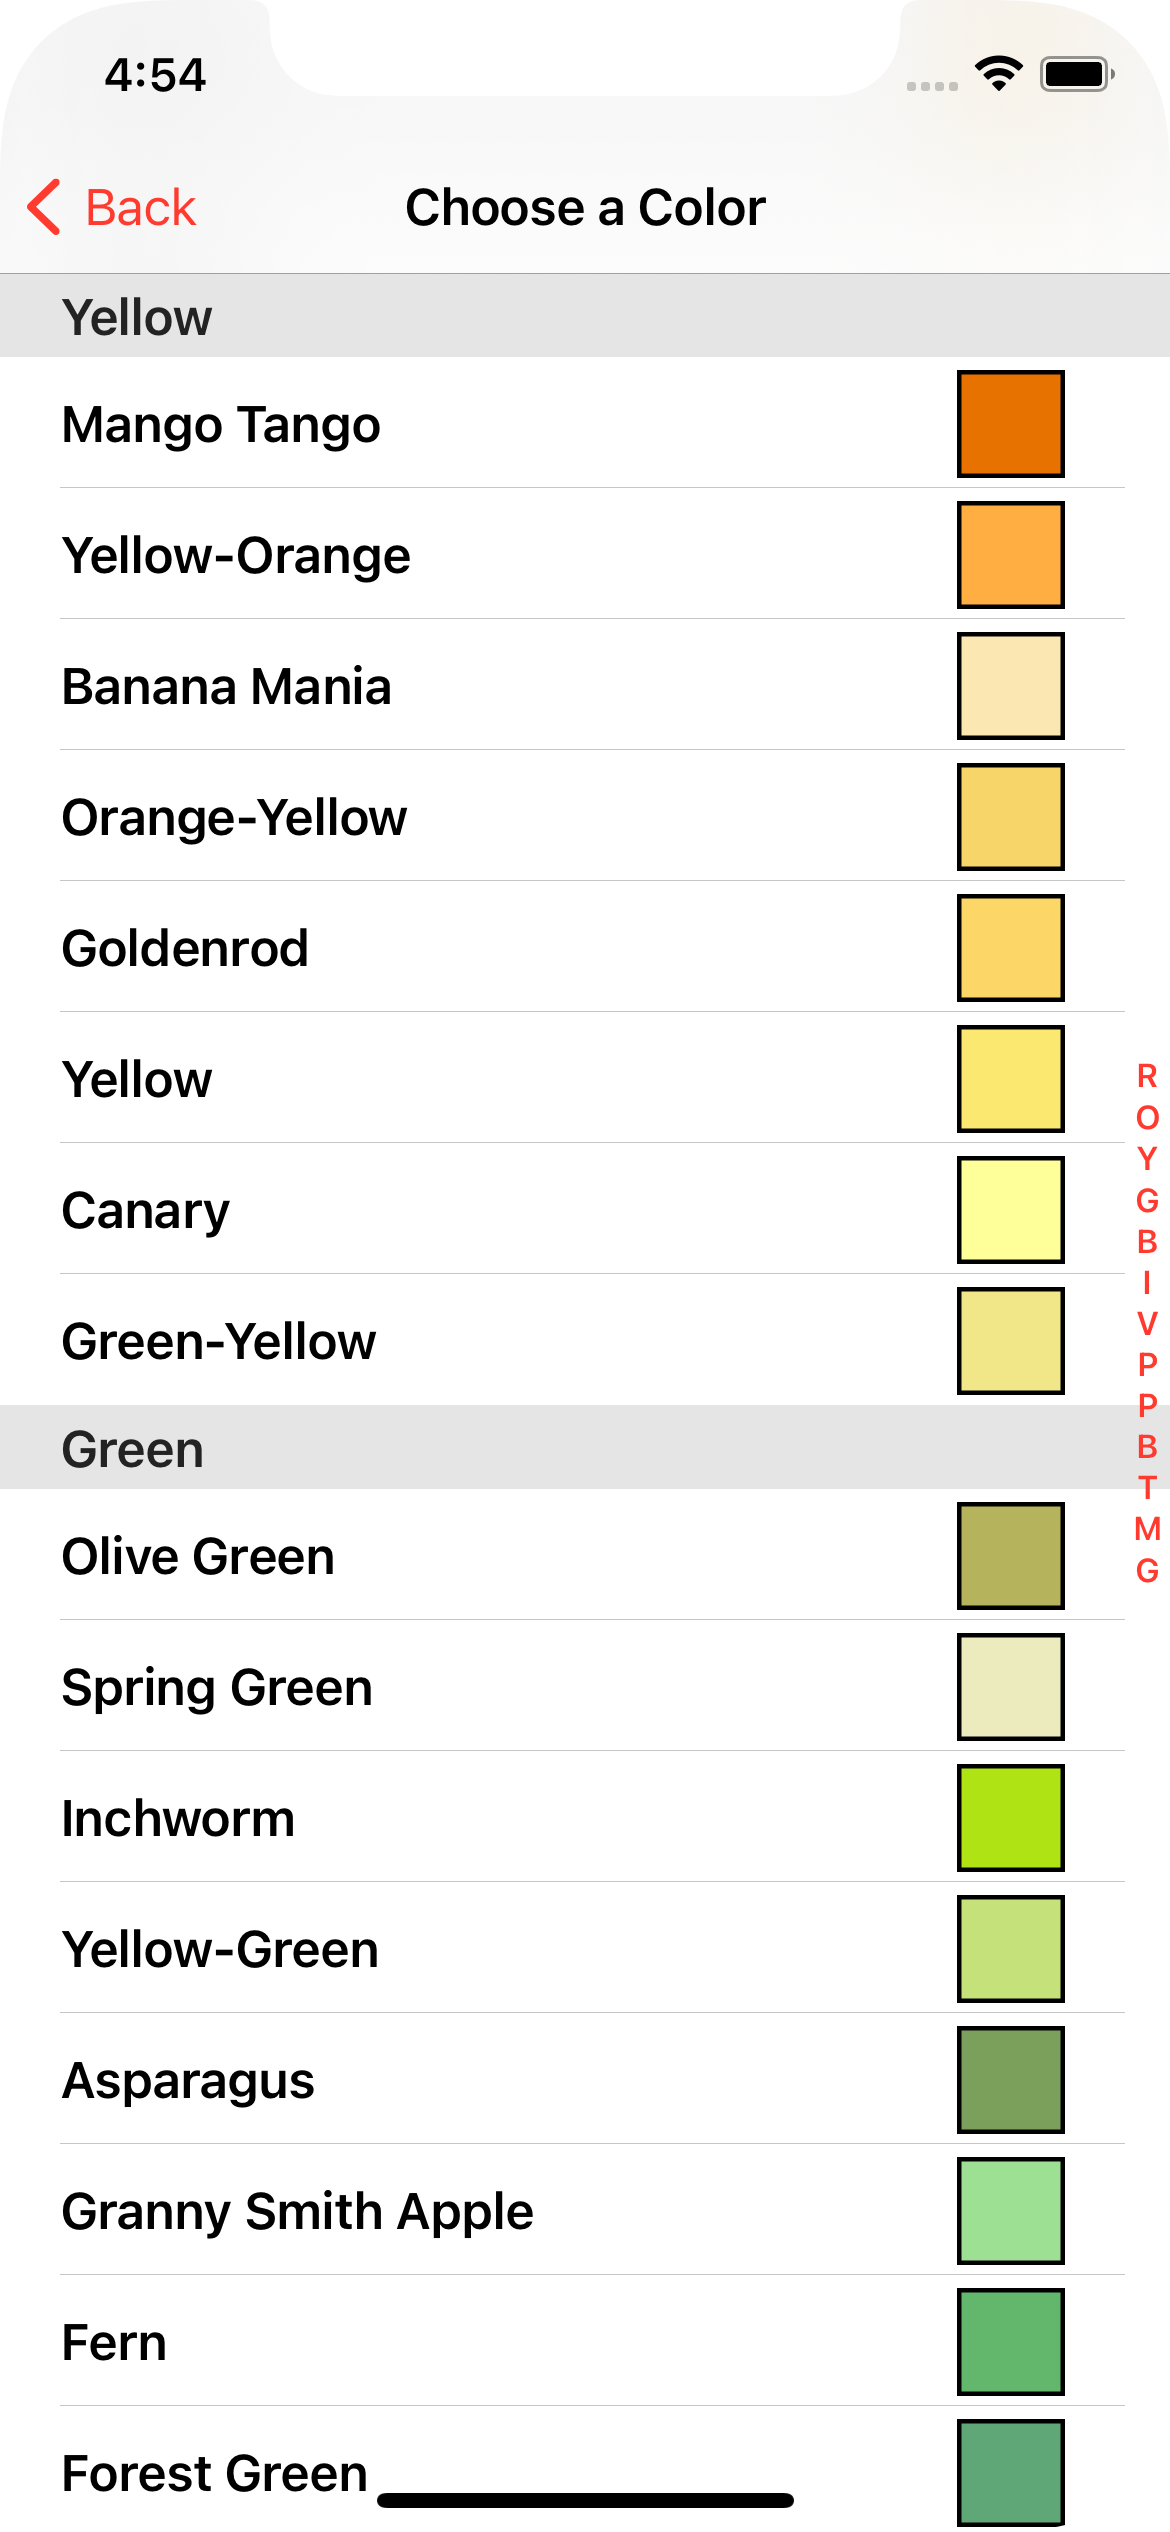
Choose Color
Tap either color.
All color selection is via the Morning Sugar color picker, which uses named colors (based on Crayola colors). There are quite a selection of available colors.
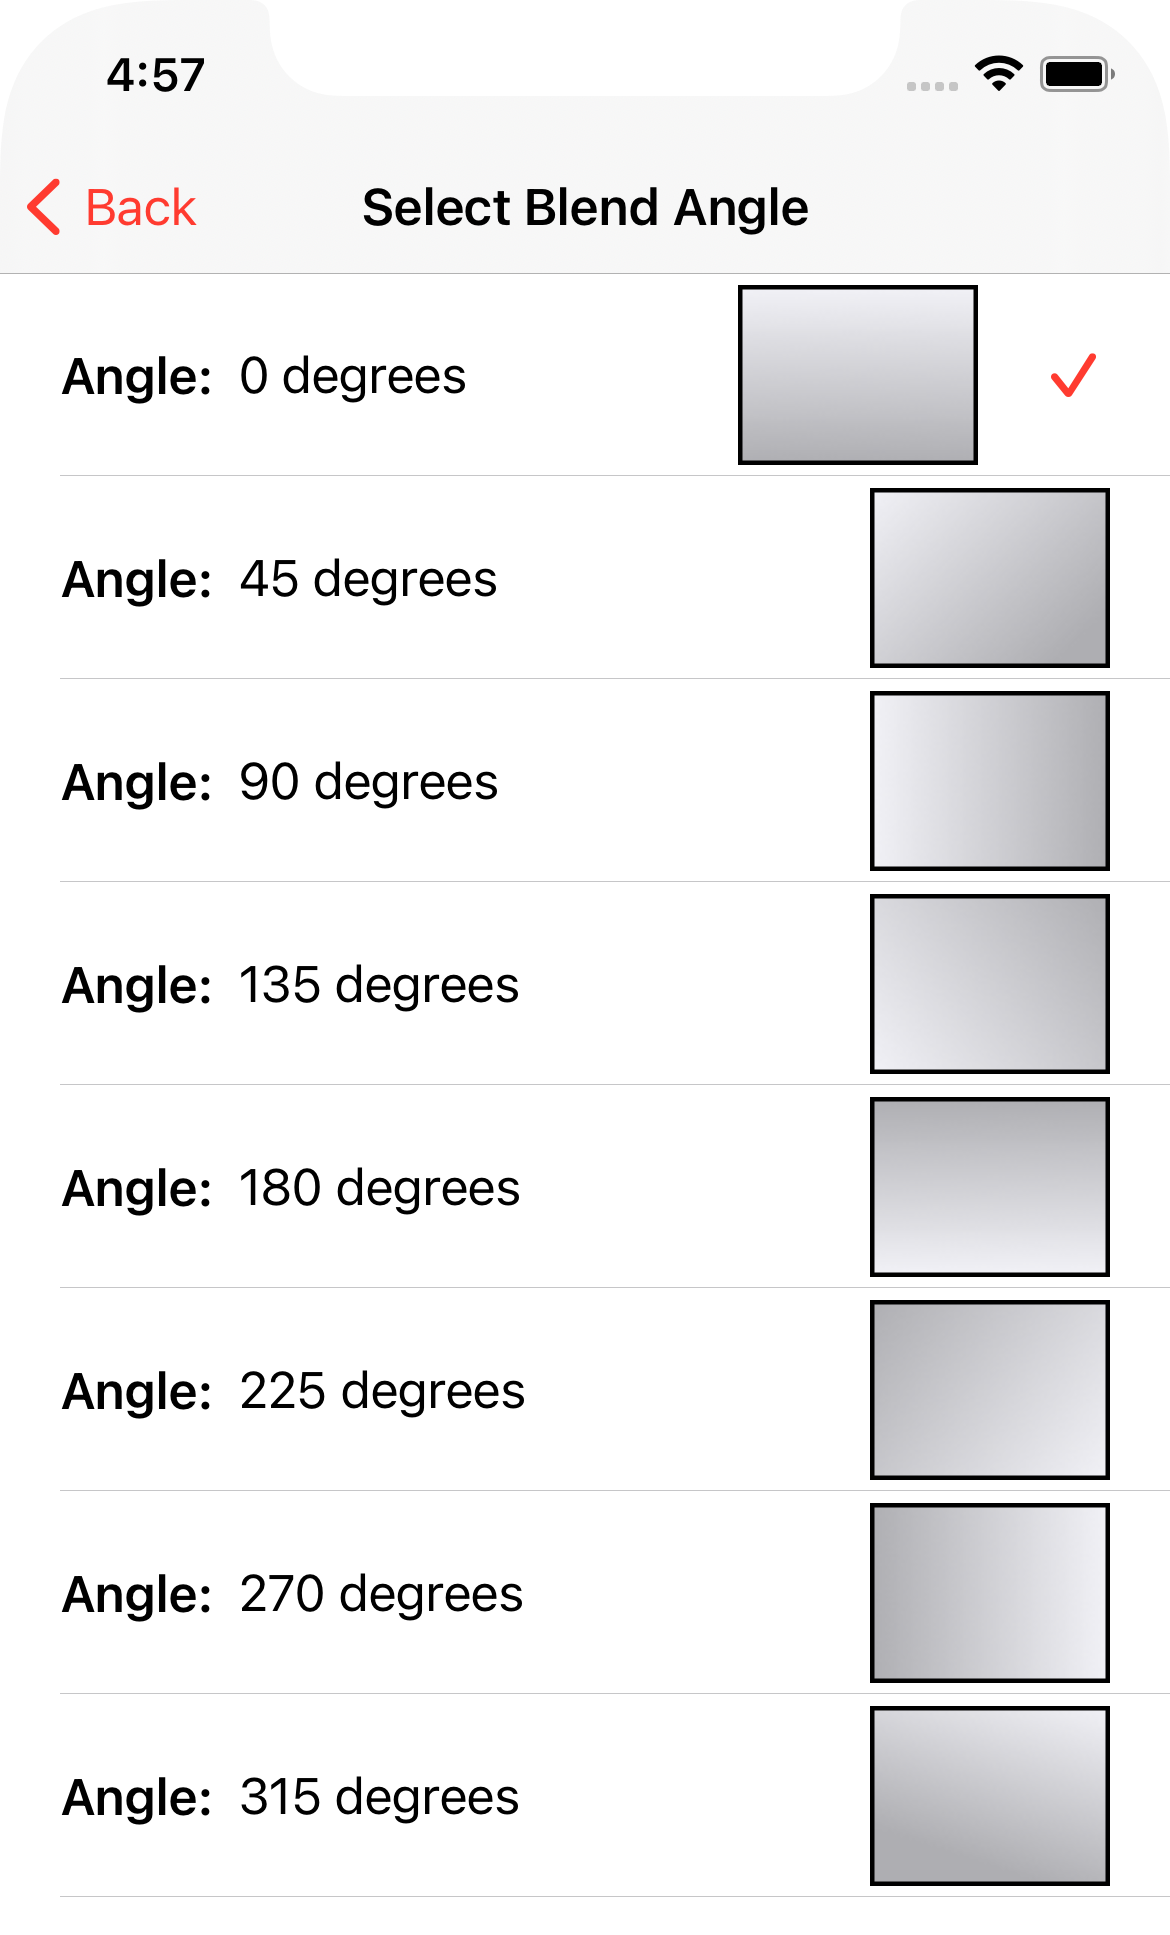
Gradient Angle
You have 8 choices of gradient angle.
Curves
Tap Curves.
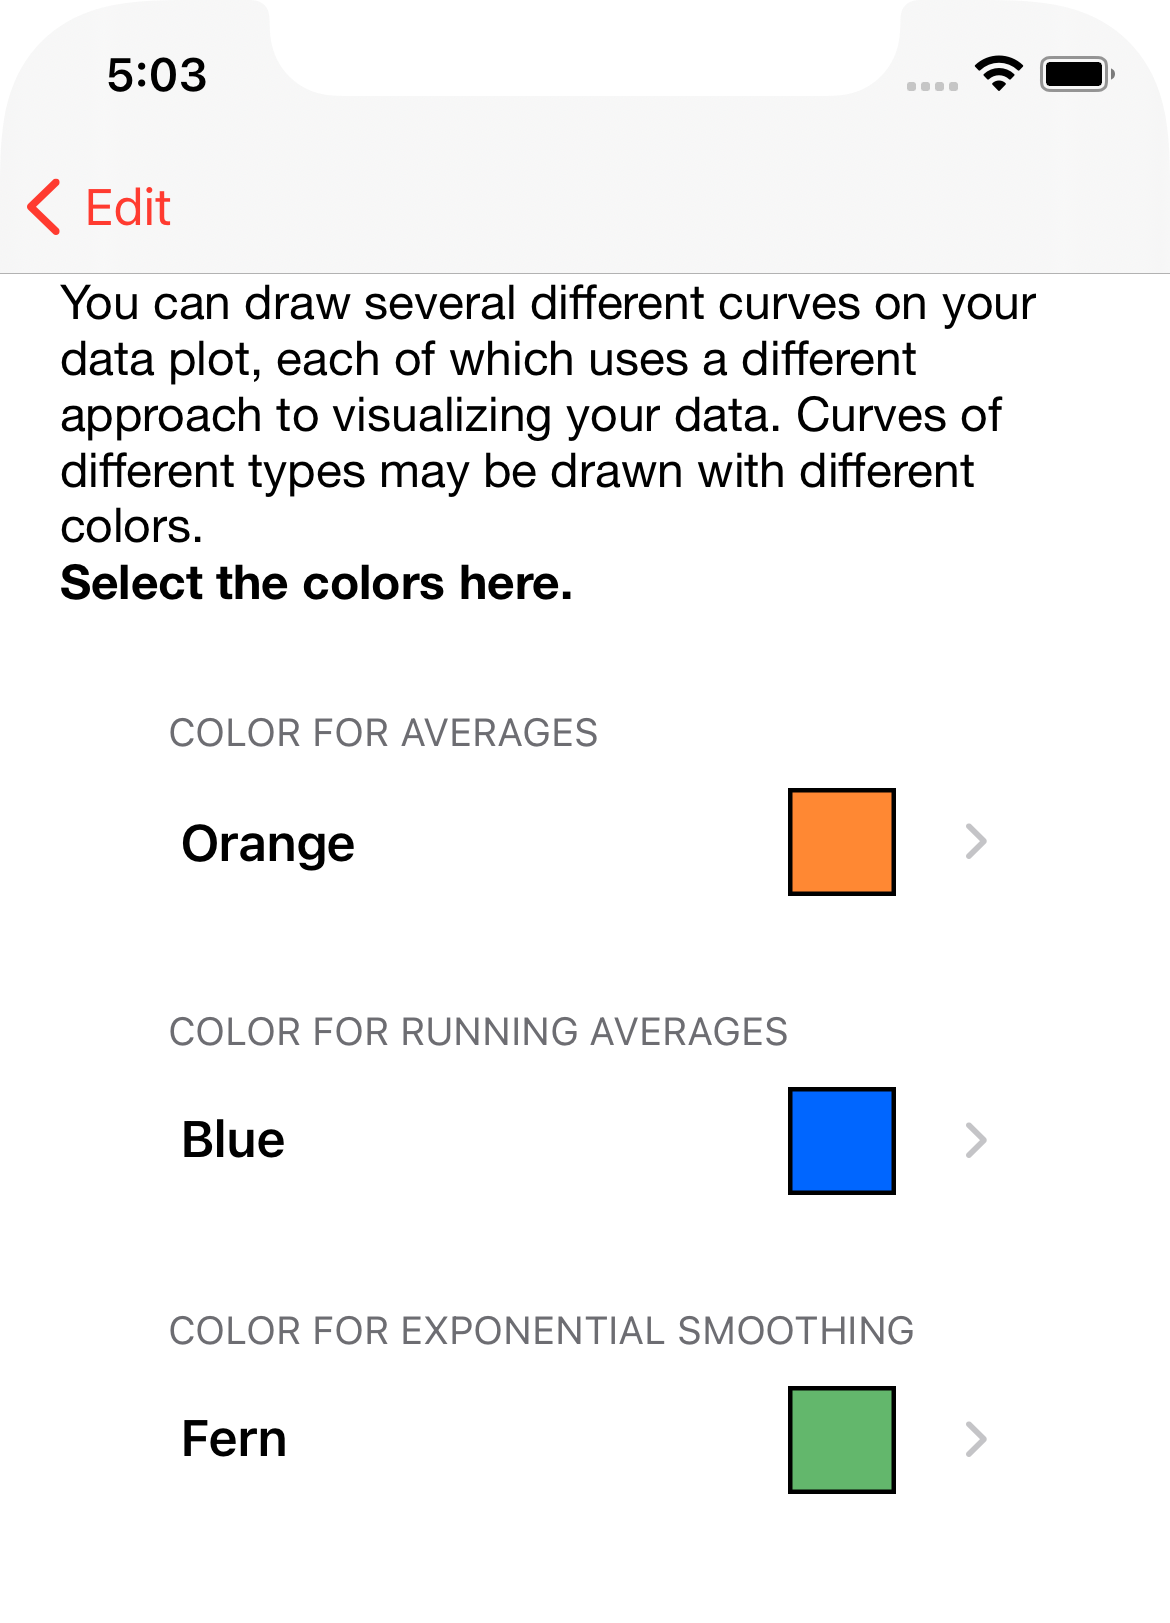
The same color picker as shown above is used here.
Y Axis Section
The Y Axis Section defines the y-axis of the plot.
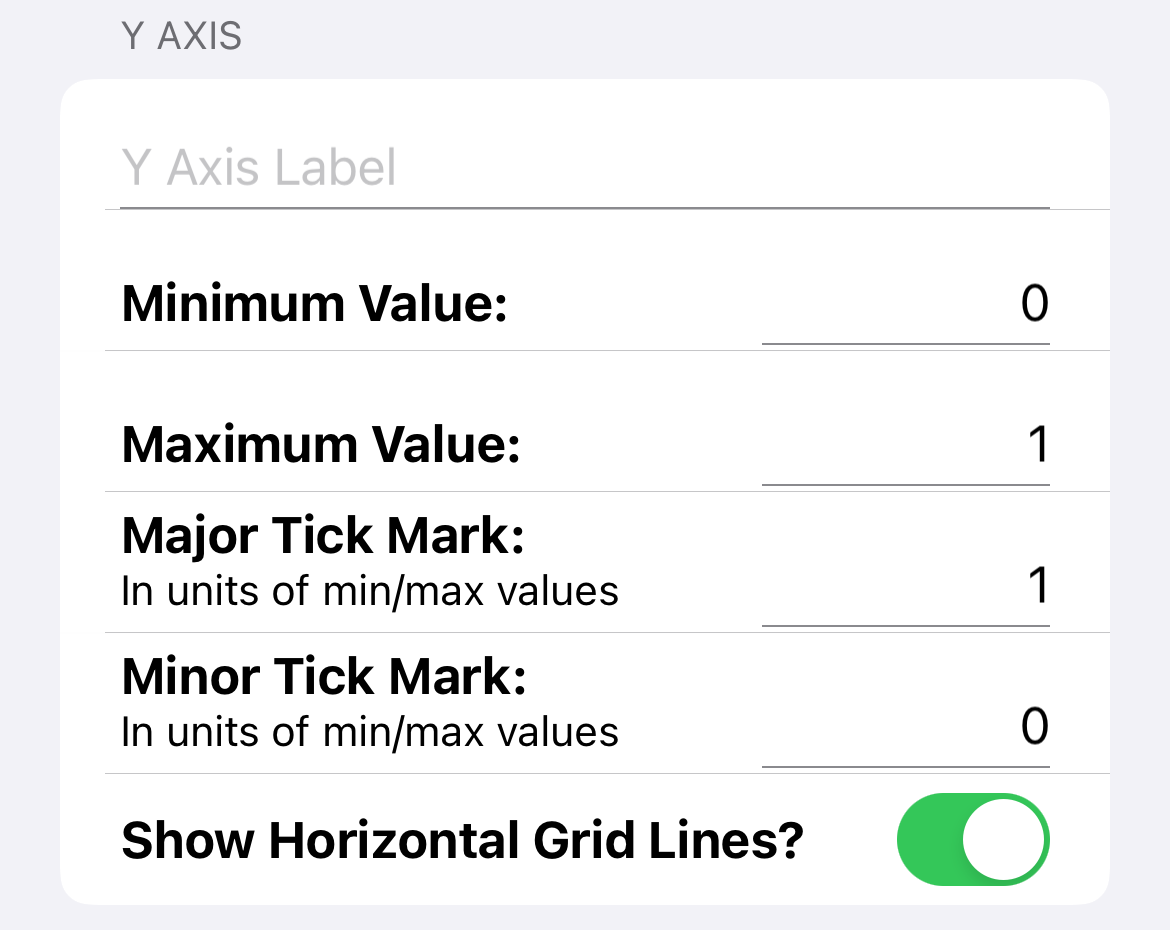
- Y Axis Label: The y-axis has an optional label.
- Minimum Value and Maximum Value: The range of values displayed. In our example (i.e., steps), the minimum value is 0 and the maximum value is some number larger than you think you'll ever need (let's say 25,000).
- Major Tick Mark: We want a reasonable number of major divisions along the y-axis. If we are displaying step counts from 0 to 25,000, then a value of 5000 for the major tick mark would result in 5 major divisions vertically, which sounds reasonable.
- Minor Tick Mark: If the major division is 5000, then if we choose a minor tick mark of 1000, this should look about right.
- Show Horizontal Grid Lines?: If yes, a line will be drawn across the plot at each major division.
X Axis Section
The X Axis Section defines the x-axis of the plot. It is simpler to configure than the y-axis because this axis always displays time and Morning Sugar makes most of the decisions for you.
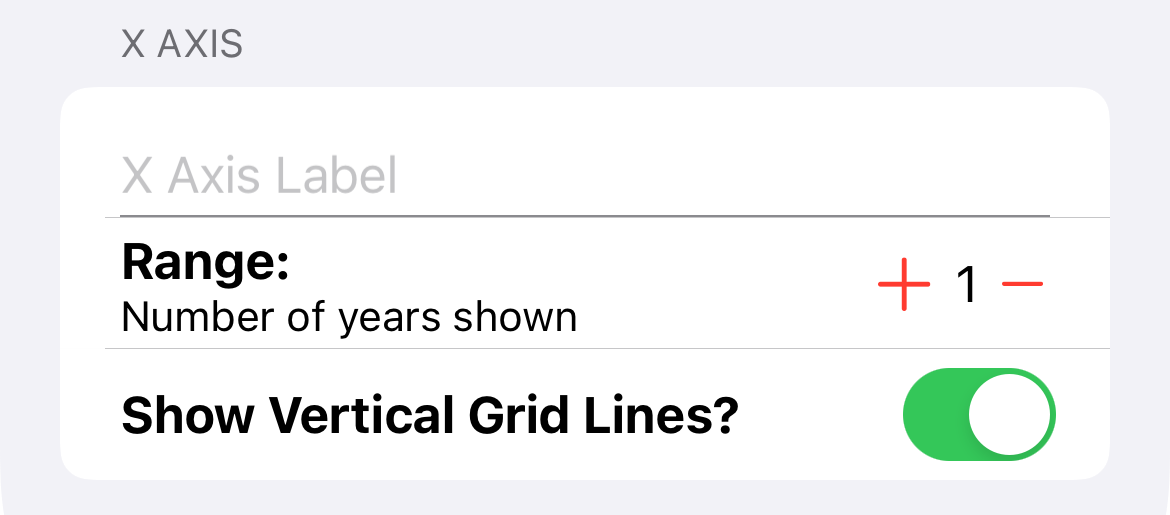
- X Axis Label: The x-axis has an optional label.
- Range: This is the number of years of data shown at a time.
- Show Vertical Grid Lines?: If yes, a line will be drawn vertically at each major x-axis division.